Abstract
The Six Sigma approach introduced by Motorola in the 1980s, in which processes are defined, analyzed and solutions are provided to minimize operational errors and to ensure operational excellence and customer satisfaction, is an approach that offers improvements not only in production but also in finance and healthcare. In this study, the DMAIC cycle which is the methodology of Six Sigma and its steps placed. The organization structure and value chain required for Six Sigma to achieve success and aimed results are stated. Critical success factors are shared to achieve targeted benefits with Six Sigma. An improvement problem has been analyzed with the DMAIC methodology in the Six Sigma study conducted with a company which manufactures trucks in the automotive industry. It was observed that the technical service received turbo-related malfunction complaints from the D segment vehicles introduced to the market after a certain period of use. Data such as month of production, current mileages, mileages of the vehicles at the moment of the problem, current age of the vehicles, the age of the vehicles at the time of the problem, the regions where the vehicles were used were analyzed. The suitability of the data groups belonging to the turbochargers of the vehicles to the normal distribution was tested. There was a significant difference in the test result. The current sigma level was calculated. B10 Life test was performed by using Minitab 10% of D segment vehicles were tested for the possibility of future turbo-related malfunctions through this test. The root cause of the failure was found by using the fishbone diagram, which is one of the problem-solving techniques. As a result of the improvements, solutions and suggestions were shared.
Özet
Motorola’nın 1980’li yıllarda uygulamaya koyduğu, operasyonel hataların en aza indirilmesi, operasyonel mükemmellik ve müşteri memnuniyetinin sağlanması için süreçlerin tanımlandığı, analiz edildiği ve çözümlerin sunulduğu Altı Sigma yaklaşımı, sadece üretimde değil sağlık ve finans sektörlerinde de iyileştirmeler sunan bir yaklaşımdır. Bu çalışmada Altı Sigma metodolojisi olan DMAIC döngüsü ve adımları yer almaktadır. Altı Sigma’nın başarıya ulaşması ve hedeflenen sonuçlara ulaşması için gereken organizasyon yapısı ve değer zinciri belirtilmektedir. Altı Sigma ile hedeflenen faydaları elde etmek için kritik başarı faktörleri paylaşılır. Otomotiv sektöründe kamyon üretimi yapan bir firma ile yapılan Altı Sigma çalışmasında DMAIC metodolojisi ile bir iyileştirme problemi analiz edilmiştir. Teknik servisin piyasaya sunulan D segmenti araçlardan belirli bir kullanım süresinden sonra turbo kaynaklı arıza şikayetleri aldığı gözlemlendi. Araçların üretim ayı, güncel kilometreleri, araçların sorun anındaki kilometreleri, araçların güncel yaşı, araçların sorun anındaki yaşı, araçların kullanıldığı bölgeler gibi veriler analiz edildi. Araçların turboşarjlarına ait veri gruplarının normal dağılıma uygunluğu test edilmiştir. Test sonucunda önemli bir farklılık vardı. Mevcut sigma seviyesi hesaplandı. Minitab kullanılarak B10 Ömür testi yapılarak D segmenti araçların %10’u bu test ile gelecekte turbo kaynaklı arıza olasılığına karşı test edildi. Problem çözme tekniklerinden biri olan Balık kılçığı diyagramı kullanılarak başarısızlığın kök nedeni bulunmuştur. Yapılan iyileştirmeler sonucunda çözüm ve öneriler paylaşılmıştır.
Keywords: DMAIC methodology, Customer satisfaction, B10 life test, Operational excellence, Automotive industry
1. INTRODUCTION
In the market, where competition is increasing day by day, customers are much more conscious. As customers cannot get the desired product or service, they immediately start to supply their requirements with another company. Therefore, the loss of customers and profits for companies can occur in a very short time. It has become a necessity for a company to provide products and services in the best way and to give importance to quality by using all its facilities to be durable under these competitive conditions. Therefore, in line with the six sigma methodology, eliminating wastes, determining the customer requirements correctly, making the most accurate and profitable production in the shortest time will provide a competitive advantage for the companies. This study aims to identify the problems that companies may encounter in the global world and to show which problems may be faced for the companies that will start to apply Six Sigma. The study will guide them to implement the Six Sigma methodology consciously. In the second section of the study, Six Sigma phenomenon is explained in general. Critical success factors, basic principles, roadmap and sigma performance scale were included. The organizational structure for the success of Six Sigma applications are placed. In the third section, the DMAIC cycle which is the methodology of Six Sigma and its steps are stated. In the fourth section, an application in the Automotive Industry is analyzed and evaluated. Finally, solutions and suggestions are shared in the last section.
2. SIX SIGMA
The history of Six Sigma is based on minimizing variances in Motorola’s systematic processes in the late 1980s to compete better with Japanese competitors (Hopp and Spearman, 2008). Motorola bases most of its quality work on the Six Sigma program. This program aims to separate the 12 sigma spread with Six Sigma on both sides of the process average and to reduce the difference in the process specification limits as shown in the standard normal distribution graph in Figure 1.1 (Yang et al., 2003).
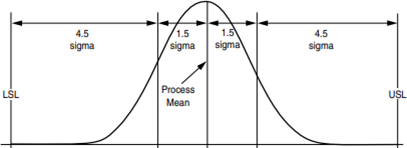
Figure 1. 1 Interpretation of Motorola’s Six Sigma Program (Yang et al., 2003)
Six Sigma is an optimized, disciplined and data-driven performance level in which the whole process from service to production is analyzed. Six sigma provides to approach zero defect by minimizing failures. The companies aim to improve the processes by reducing the variables with Six Sigma level. As a management system, it is an approach that aims to increase the profitability of companies. This approach reduces defects, rate of waste and performs customer-oriented process management in an integrated approach and statistically. At this point, three key factors should be considered to achieve the desired quality level. These: Customers, processes, and employees (Little, 2003). The basic principles of Six Sigma are: Customer- oriented, process-oriented, data-based management, proactive management, unlimited cooperation, and excellence. The road map is aligned: Identifying key processes and key customers, identifying customer requirements, measuring current performance, prioritizing and analyzing improvements, deploying and integrating the six sigma systems (Pande et al., 2003).
Table 1. 1: Sigma Performance Scale (Watson, 2005)
| Sigma Level | Defect per Million | Success Rate | Average Failure Cost (%) |
| 1.0 σ | 670 000 | 33% | >40% |
| 2.0 σ | 308 537 | 69% | 30-40% |
| 3.0 σ | 66 837 | 93,32% | 20-30% |
| 4.0 σ | 6210 | 99,38% | 15-20% |
| 5.0 σ | 233 | 100% | 10-15% |
| 6.0 σ | 3,4 | 100% | <10% |
Companies that reach the Six Sigma level are considered the best in their fields compared to their competitors. Six Sigma is aimed at 3,4 defects per million to prevent problems that may arise. Corresponding defect per million, success rate and average failure cost for each sigma level are shared in Table 1.1. Nowadays, many companies are working on 3 or 4 sigma level. It shows that the defect rates in these processes are between 6.210 and 66.800 per million. Failure cost due to scrap and repairs in these companies comprises 10-15% of sales. This rate is quite close to zero in Six Sigma companies. Considering that companies operate with an average profit of 10%, it is unlikely that companies with 3-4 sigma will gain competitive advantage and retain their presence in the market against companies that achieve Six Sigma. It is not enough for companies to use only Six Sigma techniques to be successful. Besides, they need to understand and assimilate its philosophy. Therefore, some critical points should be identified and monitored. Critical success factors for a company applying Six Sigma methodology “Participation and Support of Senior Management, Organizational Infrastructure, Cultural Change, Education, Customer Focus, Linking Six Sigma to Business Strategies and Financial Objectives, Participation of Employee, Understanding Six Sigma Methodology, Project Management Skills, Project Selection and Prioritization, Leadership” can be aligned (Raghunath ve Jayathirtha, 2013). The most important reason for the success of companies with Six Sigma applications is that the method is systematic and disciplined. What makes it systematic and disciplined is the underlying Six Sigma organizational structure. This structure is shown in Table 1.2.
Table 1.2: Roles and Responsibilities in Six Sigma (George, 2002)
| Senior Management | Leads to change. Determines vision. |
| Sponsor | Part-time. Assists to solve problems. Trains the project team. |
| Champion | Full time. Leads the business performance development process. |
| Master Black Belt | Part-time. Leads major projects. Trains black and green belt. |
| Black Belt | Full time or part-time. Trains the project team. Assists the project team. |
| Green Belt | Part-time. Leads minor project. |
| Team Members | Short time. Provides specific support for projects. |
Traditional companies operate at 3-4 sigma levels. Table 1.3 indicates the reflection of defect rates in real life.
Table 1. 3: The Reflection of Defect Rates to Real Life (Polat et al., 2005)
| Example | %99 (3.8 Sigma) | %99.99966 (6 Sigma) |
| Lost labor hours in 10 000 employees | 100 man-day | 49 minutes |
| Monthly power outage | 7,2 hours | 8,8 seconds |
| The danger of severe turbulence at six-hour flight | 3,6 minutes | 0,1 seconds |
| Lost in 1 000 000 $ investment | $10000 | $3,4 |
Table 1.3 shows that there are significant differences between sigma levels in terms of error rates. The benefits of Six Sigma can be aligned as follows: Costs are reduced, productivity and market share increases, customer continuity is ensured, cycle time and defect rates decrease, culture change is provided, outputs are focused instead of inputs, management of outputs is aimed by controlling inputs, systematic, each step leads the next step, problems are defıned statistically, the inputs and outputs are analyzed and evaluated as data- driven, improvements are compared with the initial situation of the project, the success of the project is explicitly demonstrated, and the improvements in the process are maintained continuity with an explicit control plan.
3. DMAIC METHODOLOGY
Six Sigma is not just a quality production or service method. In addition to improving quality and continuous improvement are also aimed here. There are multiple models in the implementation of this method. However, almost all of these models are based on W. Edward Deming’s cycle (Plan, Do, Check, Act) (Gürses, 2005). The DMAIC methodology which is a data-driven cycle is one of the most important reference of Six Sigma projects for process improvements. The DMAIC is an abbreviation of five steps. These steps can be listed as follows: Define, Measure, Analyse, Improve and Control. If it is necessary to make a simplified description of each step, Define: Problem identification, prioritization and selection of the right project, Measure: Determining the scope and performance of the parameters, Analyse: Identifying the process determinants and root causes of the problem, Improve: Improving the process by changing and finding optimization solutions, Contol: Evaluating the results of the solutions obtained in the previous stage and ensuring that the gains are sustainable (Sokovic et al., 2010).
4. APPLICATION
This section aims to observe the improvements provided by the Six Sigma methodology with implementation on the project in the automotive industry. Due to the information security risks, information of the company that the study was conducted was kept confidential.
4.1 Define phase
At the beginning of the project, customer complaints which came from only D segment vehicles among A, B and D segments, which were produced and presented to the market, due to the failure of the turbocharger in the after a certain period of use were examined and identified. The target of the project is to achieve a high level of service and customer satisfaction by reducing customer complaints of D segment vehicles. D segment vehicles are within the scope of the project and A and B segment vehicles are excluded. The implementation area of the project is the turbochargers of the D segment vehicles. The project team includes a champion, a black belt, two green belts, and three team members. The predicted earnings at the end of the project: 19 vehicles/year and 53.320.000 TL / year.
4.2 Measure phase
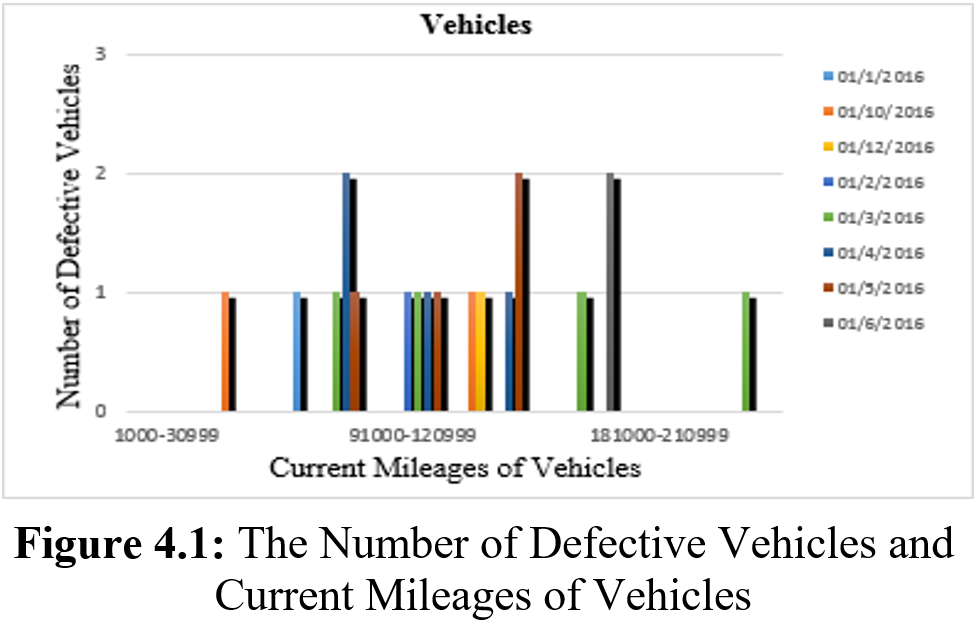
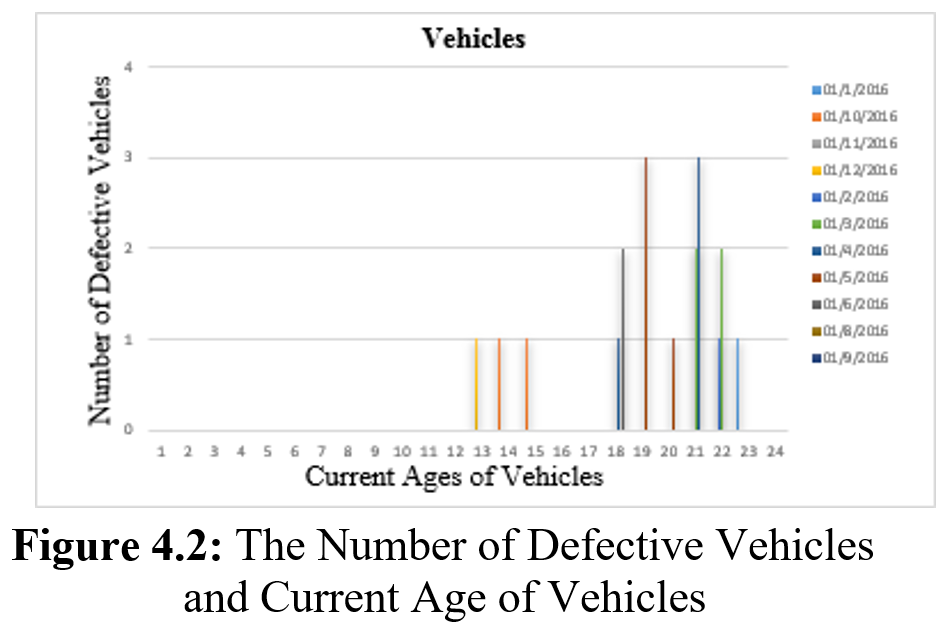
Total of 3983 vehicles from A, B and D segments were examined in the existing situation. Data such as month of production, current mileages, mileages of the vehicles at the time of the problem, current age of the vehicles, age of the vehicles at the time of the problem, regions where the vehicles were used were collected and analyzed. It was observed that failures caused by turbocharger occur only in D segment vehicles. In total, only 19 vehicles out of 3155 came to the technical service due to turbo-related malfunction. Once the data was examined, as seen in Figure 4.1 that only the vehicles produced in 2016 and whose current kilometers were in the range of 60.000-160.000 kilometers are more likely to malfunction. Figure 4.2 shows that the current age distribution of defective vehicles is in the 18-22 range. The frequency appears higher in this range than in other months.
The specification limit determined by marketing strategies is 400 000 kilometers and there is no demand for turbo related failures from the vehicles before this kilometers. One of the critical quality features, “turbocharger failures in vehicles” was decided to make improvements in the current situation.
4.3 Analyse phase
At this stage of the study, it is necessary to establish hypotheses to determine the suitability of the data groups to normal distribution. The hypotheses ?0 and ?1 were determined as follows:
?0 (null hypothesis): The proportion of 10% of the vehicles which will be produced in the future will run smoothly up to 400,000 kilometers.
?1 (alternative hypothesis): The proportion of 10% of the vehicles will be produced in the future will fail before 400,000 kilometers.
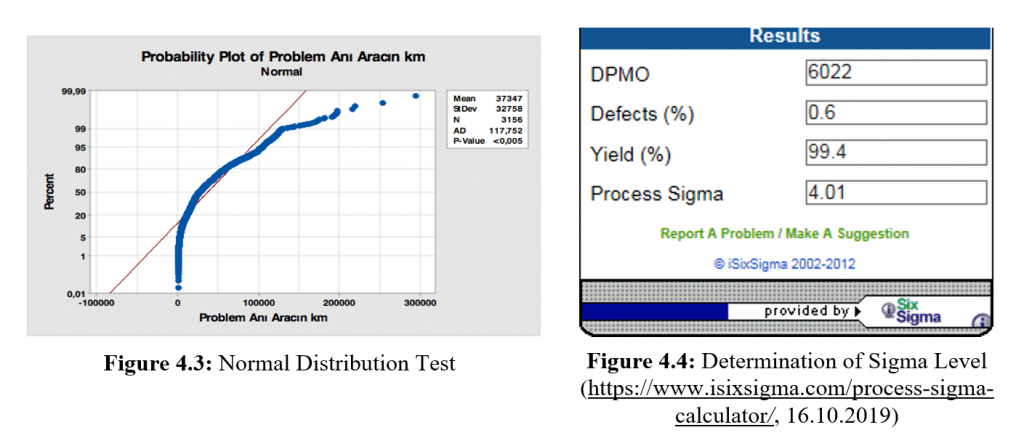
In Figure 4.3, the suitability of the data groups to the normal distribution in terms of kilometer under the significance level α = 0.05 was tested. Since P <α, there was a statistically significant difference in the test result. The probability of rejection of ?0 hypothesis was increased based on this result. The test indicates that there is a possibility of failure before 400 000 kilometers from the proportion of 10% of the vehicles which will be produced in the future. As shown in Figure 4.4, the current sigma level was calculated at 4.01.
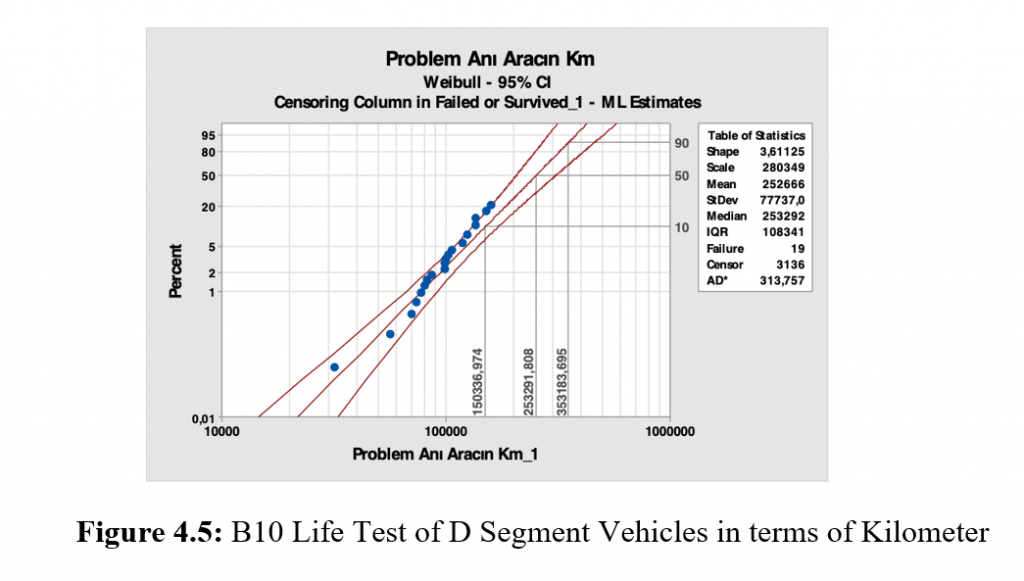
B10 life test was performed on the D segment vehicles with the Minitab program. The test expresses the time at which a 10% of the masses in a population will fail at a point, or a 90% reliability of a population at a certain point in its life with Weibull distribution (https://blog.minitab.com/blog/meredith-griffith/how-to- calculate-b10-life-with-statistical-software, 20.10.2019). In Figure 4.5, the failure of 10% of the D segment vehicles was tested in terms of kilometers. As can be seen from the figure, there is a possibility of failure in the 10% of D segment vehicles which will be produced in the future due to turbocharger at 150.336 km. The proportion of 90% includes the probability of failure at 353.183 km. As per the quality standards, no malfunction is expected before 400.000 kilometers.
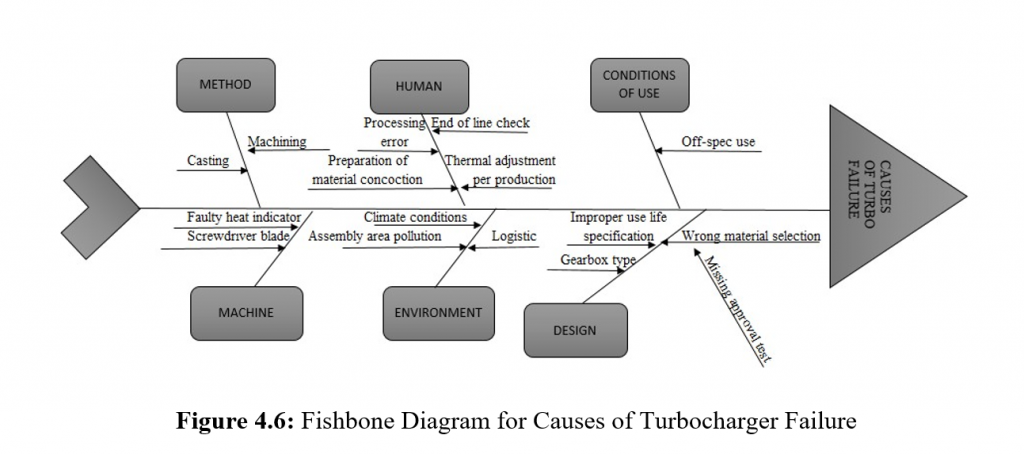
The possible causes of failure as a result of brainstorming by creating quality circles were determined through the fishbone diagram in figure 4.6. Once the reasons were examined, it is found that there was a design problem in the turbochargers of the vehicles and it was concluded that the material selection was wrong due to the lack of approval test which was the root cause. The supplier company chose the material of turbochargers based on the B segment vehicles and adapted them to the D segment vehicles by interpolation method without laboratory and vehicle driving tests . The operating conditions of the B segment vehicles are suitable for a light load (25 tonnes), long distance (1 000.000 km), and flat terrain, and differ considerably from D segment vehicles used in conditions such as heavy load (50 tonnes), short distance (400 000 km), and rough terrain. As a result of the incomplete approval test, the turbochargers designed for the B segment was adapted to the D segment vehicles. This caused turbocharger failure in the D segment vehicles.
4.4 Improve phase
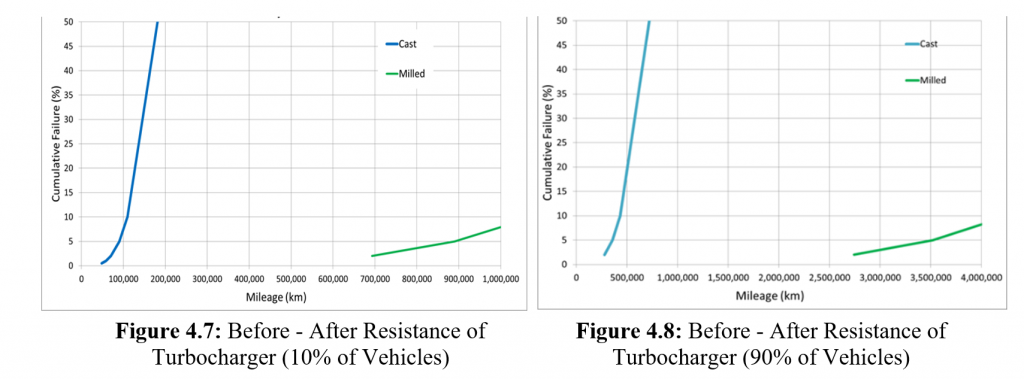
In the turbocharger production phases, the material is casted and then tempered. The tempered material is then subjected to machining. During the process, casted aluminum material was using and then machining. However, the air bubbles formed during casting reduces the strength and thus the resistance. For this reason, completely non-casted full aluminum material was used in the improvement phase and then processed on machining. Figure 4.7 and Figure 4.8 compare the turbochargers resistance of the vehicles in terms of kilometers before and after improvement. Figure 4.7 shows that the vehicles reached at 700 000 kilometers without any turbo-related malfunction after the improvement while 10 % of the vehicles failed at 150.000 kilometers before improvement and the Figure 4.8 illustrates that the vehicles approached at 2 750 000 kilometers after the improvement while 90 % of the vehicles failed at 350.000 kilometers.
The turbochargers of defective vehicles were replaced with the newly designed turbochargers to increase customer satisfaction. It was planned for this turbocharger design to the new D segment vehicles to prevent potential customer complaints.
4.5 Control phase
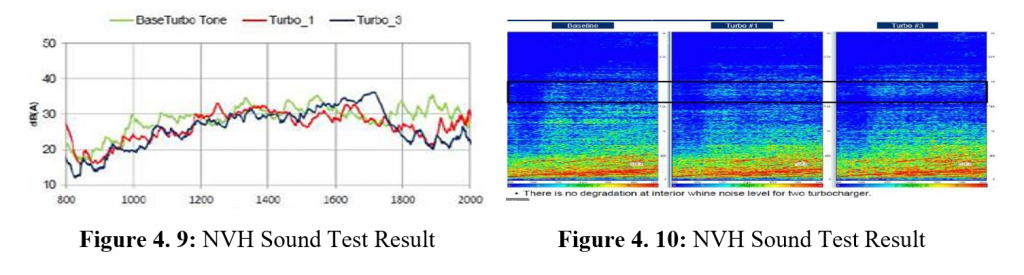
The newly designed turbochargers were first tested for durability. The test medium was run for 400 hours. As a result of this study, propeller, shaft, o-ring, bearing and similar components in turbo were examined one by one. No deformation and gas leak was observed in the newly designed turbocharger. Afterward, NVH (Noise Vibration & Harshness) test was performed. The new turbocharger was tested by placing in A and D segment tester vehicles and some sound measurements were performed. This measurement was used to examine if there is any chunking in the turbocharger. The sound test results show the expected level as shown in Figure 4.9 and Figure 4.10.
Lastly, the newly designed turbochargers are placed in two customer vehicles and monitored for 4 weeks. No complaints were received as a result of the study.
5. CONCLUSION
Nowadays, in increasingly competitive conditions, companies are supposed to communicate with customers strongly to understand their requests and requirements correctly for being long-termed. Customers are the value structure of companies. The basis of Six Sigma is to create customer value. Many companies will see deficits as a result of complaints and suggestions that come from customers. The companies which make improvements in this direction will provide customer satisfaction and make a profit as a side function. This is exactly what Six Sigma will offer companies the opportunity to review, renew and enhance their existing systems in line with the requirements of customers. Since it is a customer-oriented approach, the field of application is increasing by many companies. This approach, which was mostly used in the production sector in the early days has been successfully applied in the service sector. In this study, an application in the automotive industry was given. Complaints that came from customers due to turbocharger failure were examined with an application and it was aimed to minimize these complaints without compromising the quality of production and service. Six Sigma’s DMAIC methodology was applied step by step for the improvement. At the end of the project, turbochargers of all vehicles were replaced with new turbochargers designed and possible failures that might occur in the vehicles which will be produced later were prevented. Annual cost saving of TL 53.320.000 were achieved. Sigma level reached approximately five sigma levels accepted in company’s production processes. It was aimed to ensure continuity with the support of senior management.
6. REFERENCES
George, M. (2003), Lean Six Sigma for Service, New York: McGraw Hill Education.
Gürses, D. (2005), İşletmelerde Kalitenin Sürekliliğinin Sağlanmasında Altı Sigma Yaklaşımı ve Bir Uygulama Örneği. (Tezsiz Yüksek Lisans Projesi), Dokuz Eylül Üniversitesi, Sosyal Bilimler Enstitüsü.
Hopp, W., Spearman, M. (2008), Factory Physics, Illinois: Waveland Press Inc.
Little, B. (2003), “Six sigma” techniques improve the quality of e-learning, Industrial and Commercial Training, 35(3).
Pande, P., Neuman, R., Cavanagh, R. (2003), The Six Sigma Way Team Fieldbook: An Implementation Guide for Process Improvement Teams, New York: McGraw-Hill Education.
Polat, A., Cömert, B., & Arıtürk, T. (2005), Altı Sigma Nedir?, Ankara: SPAC Altı Sigma Danışmanlık.
Raghunath, A., Jayathirtha, V. (2013), Critical Success Factors for Six Sigma implementation by SMEs. International Journal of Scientific & Engineering Research, 4(2).
Sokovic, M., Pavletic, D., Pipan, K. K. (2010), Quality improvement methodologies–PDCA cycle, RADAR matrix, DMAIC and DFSS, Journal of achievements in materials and manufacturing engineering, 43(1).
Yang, K., Basem, S., El-Haik, B. (2003), Design for six sigma, New York: McGraw-Hill. Watson, G. (2005), Design for Six Sigma, Salem: GOAL/QPC. https://www.isixsigma.com/process-sigma-calculator/ (DateAccessed: 16.10.2019).
https://blog.minitab.com/blog/meredith-griffith/how-to-calculate-b10-life-with-statistical- software (Date Accessed: 20.10.2019).